What is Nexly?
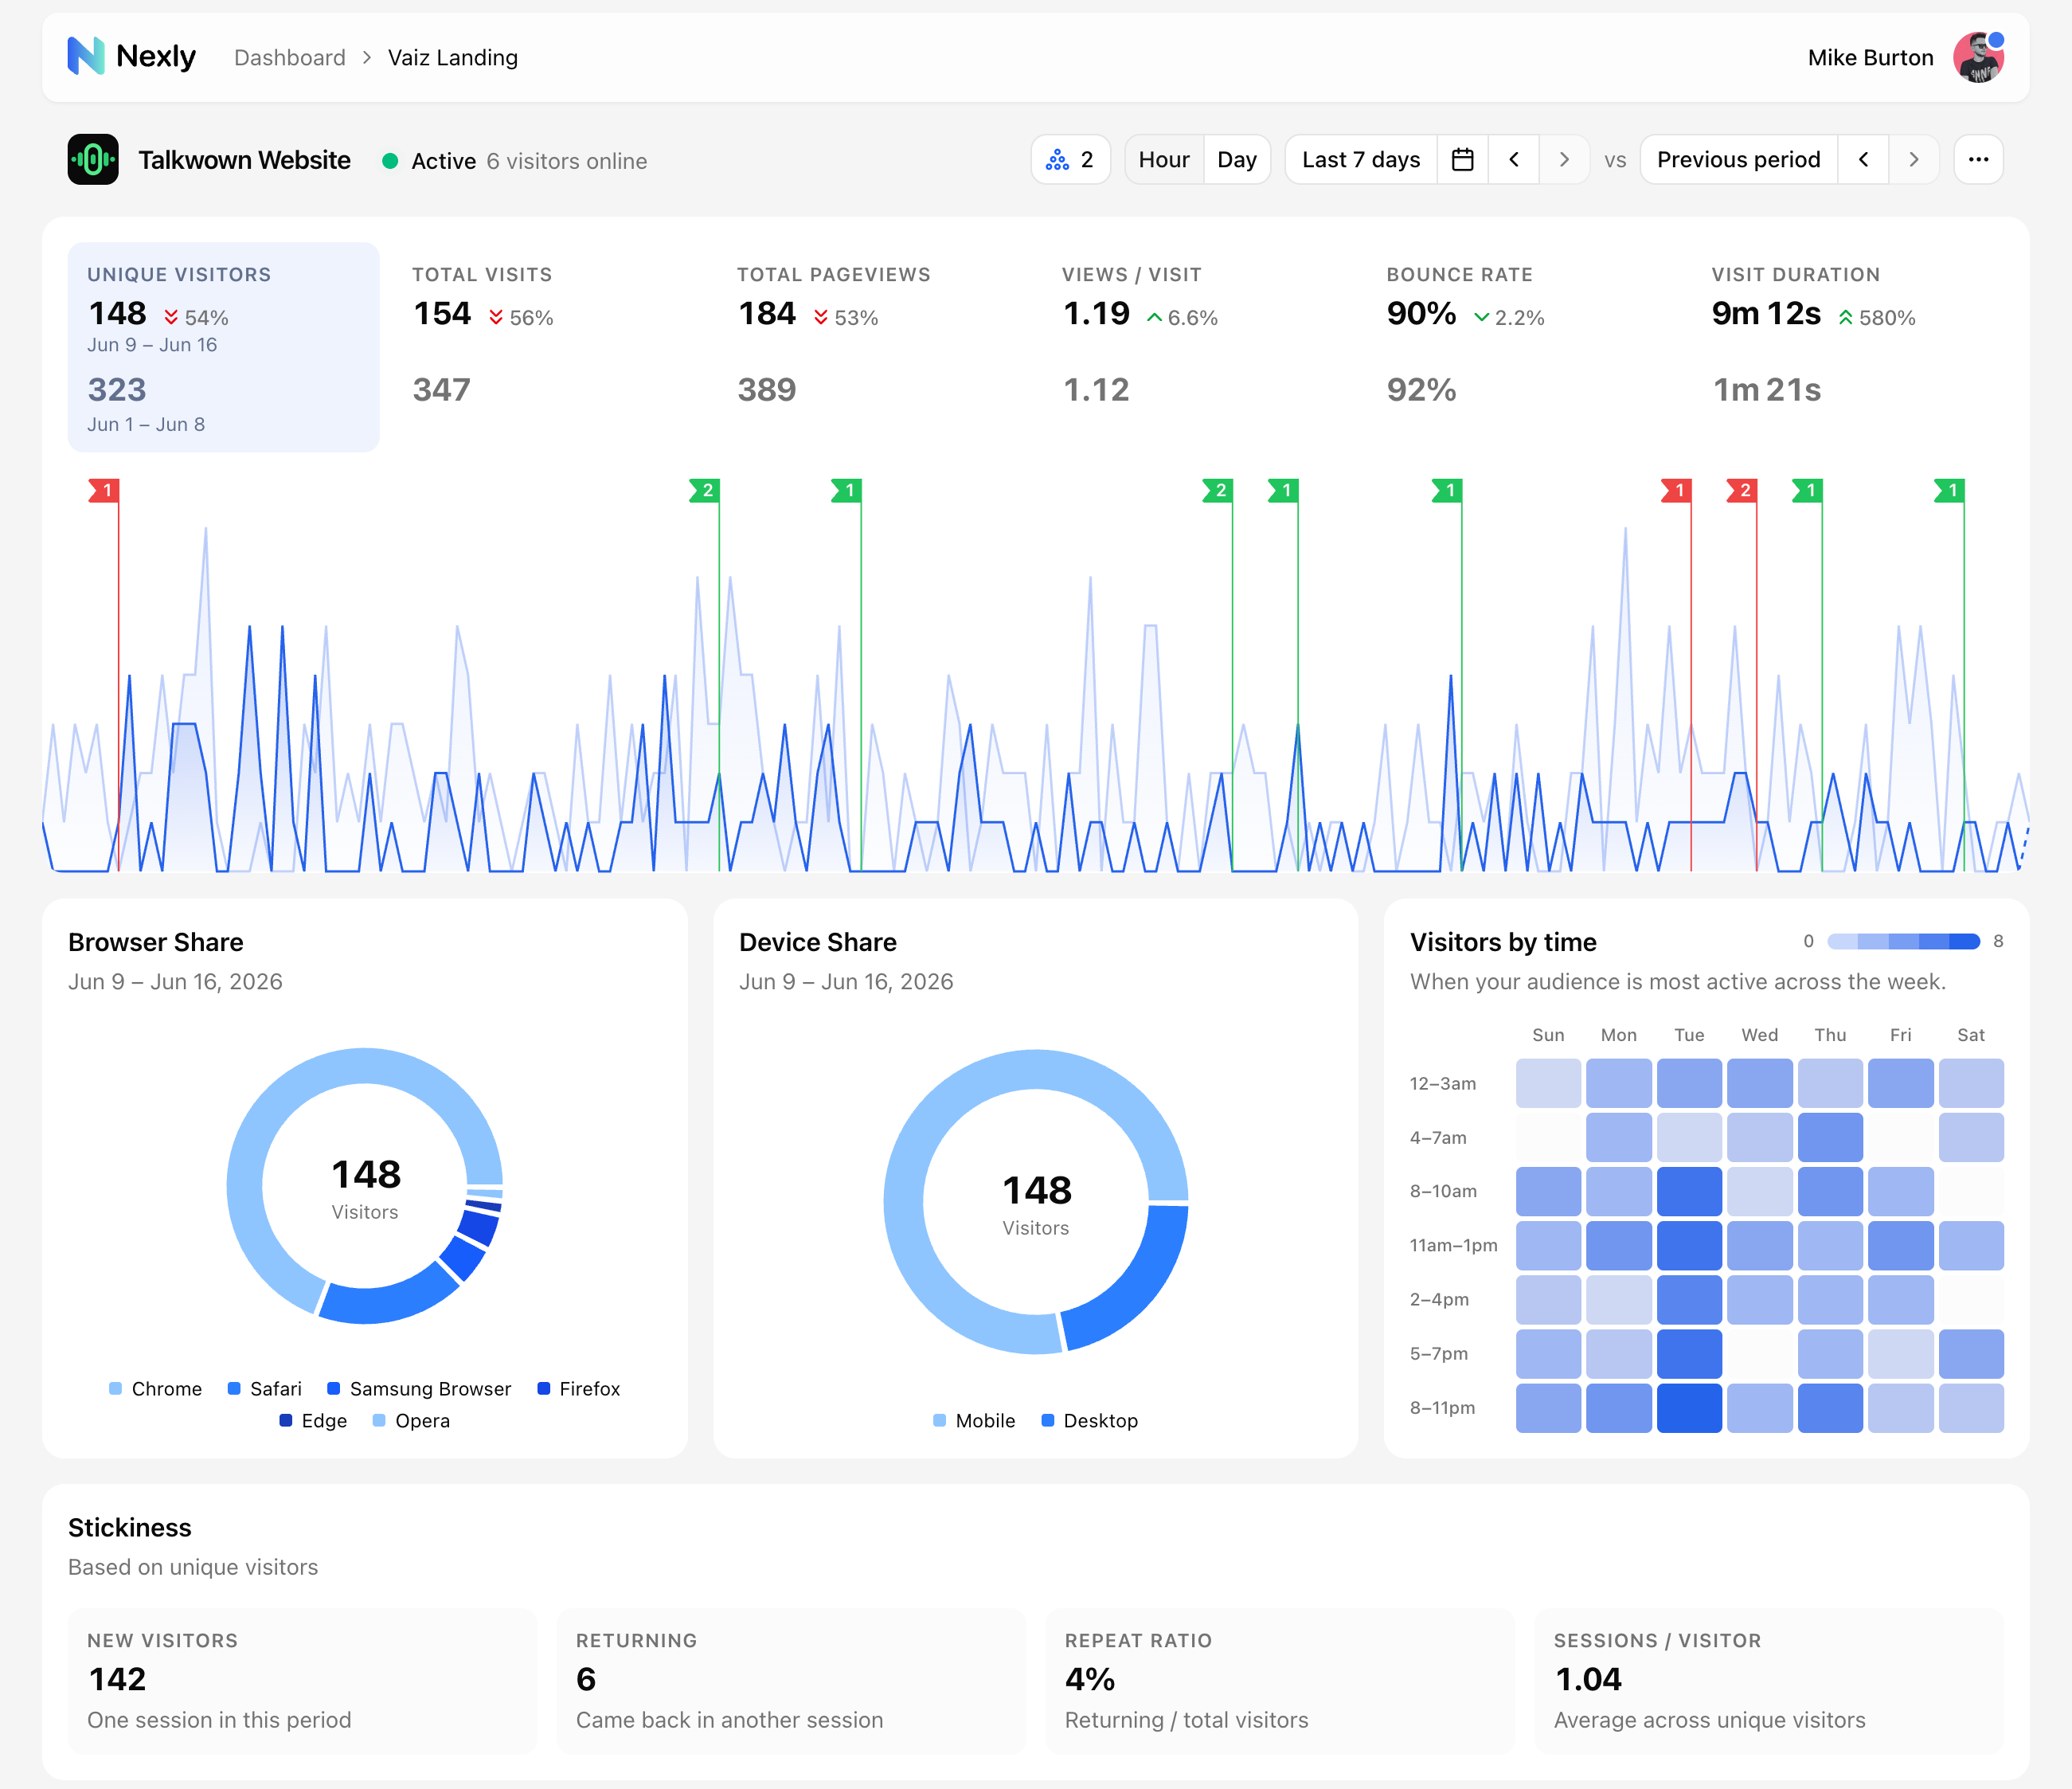
Nexly is an analytics product for understanding how people use your web, mobile, and backend-powered products. It collects pageviews, sessions, engagement, custom events, acquisition data, geography, device information, bot activity, reports, and anomalies in one dashboard.
Use Nexly when you want a clear view of product behavior without building your own event pipeline.
Core concepts
Account is your personal Nexly workspace. Account settings include security, profile preferences, billing, notifications, and personal API tokens.
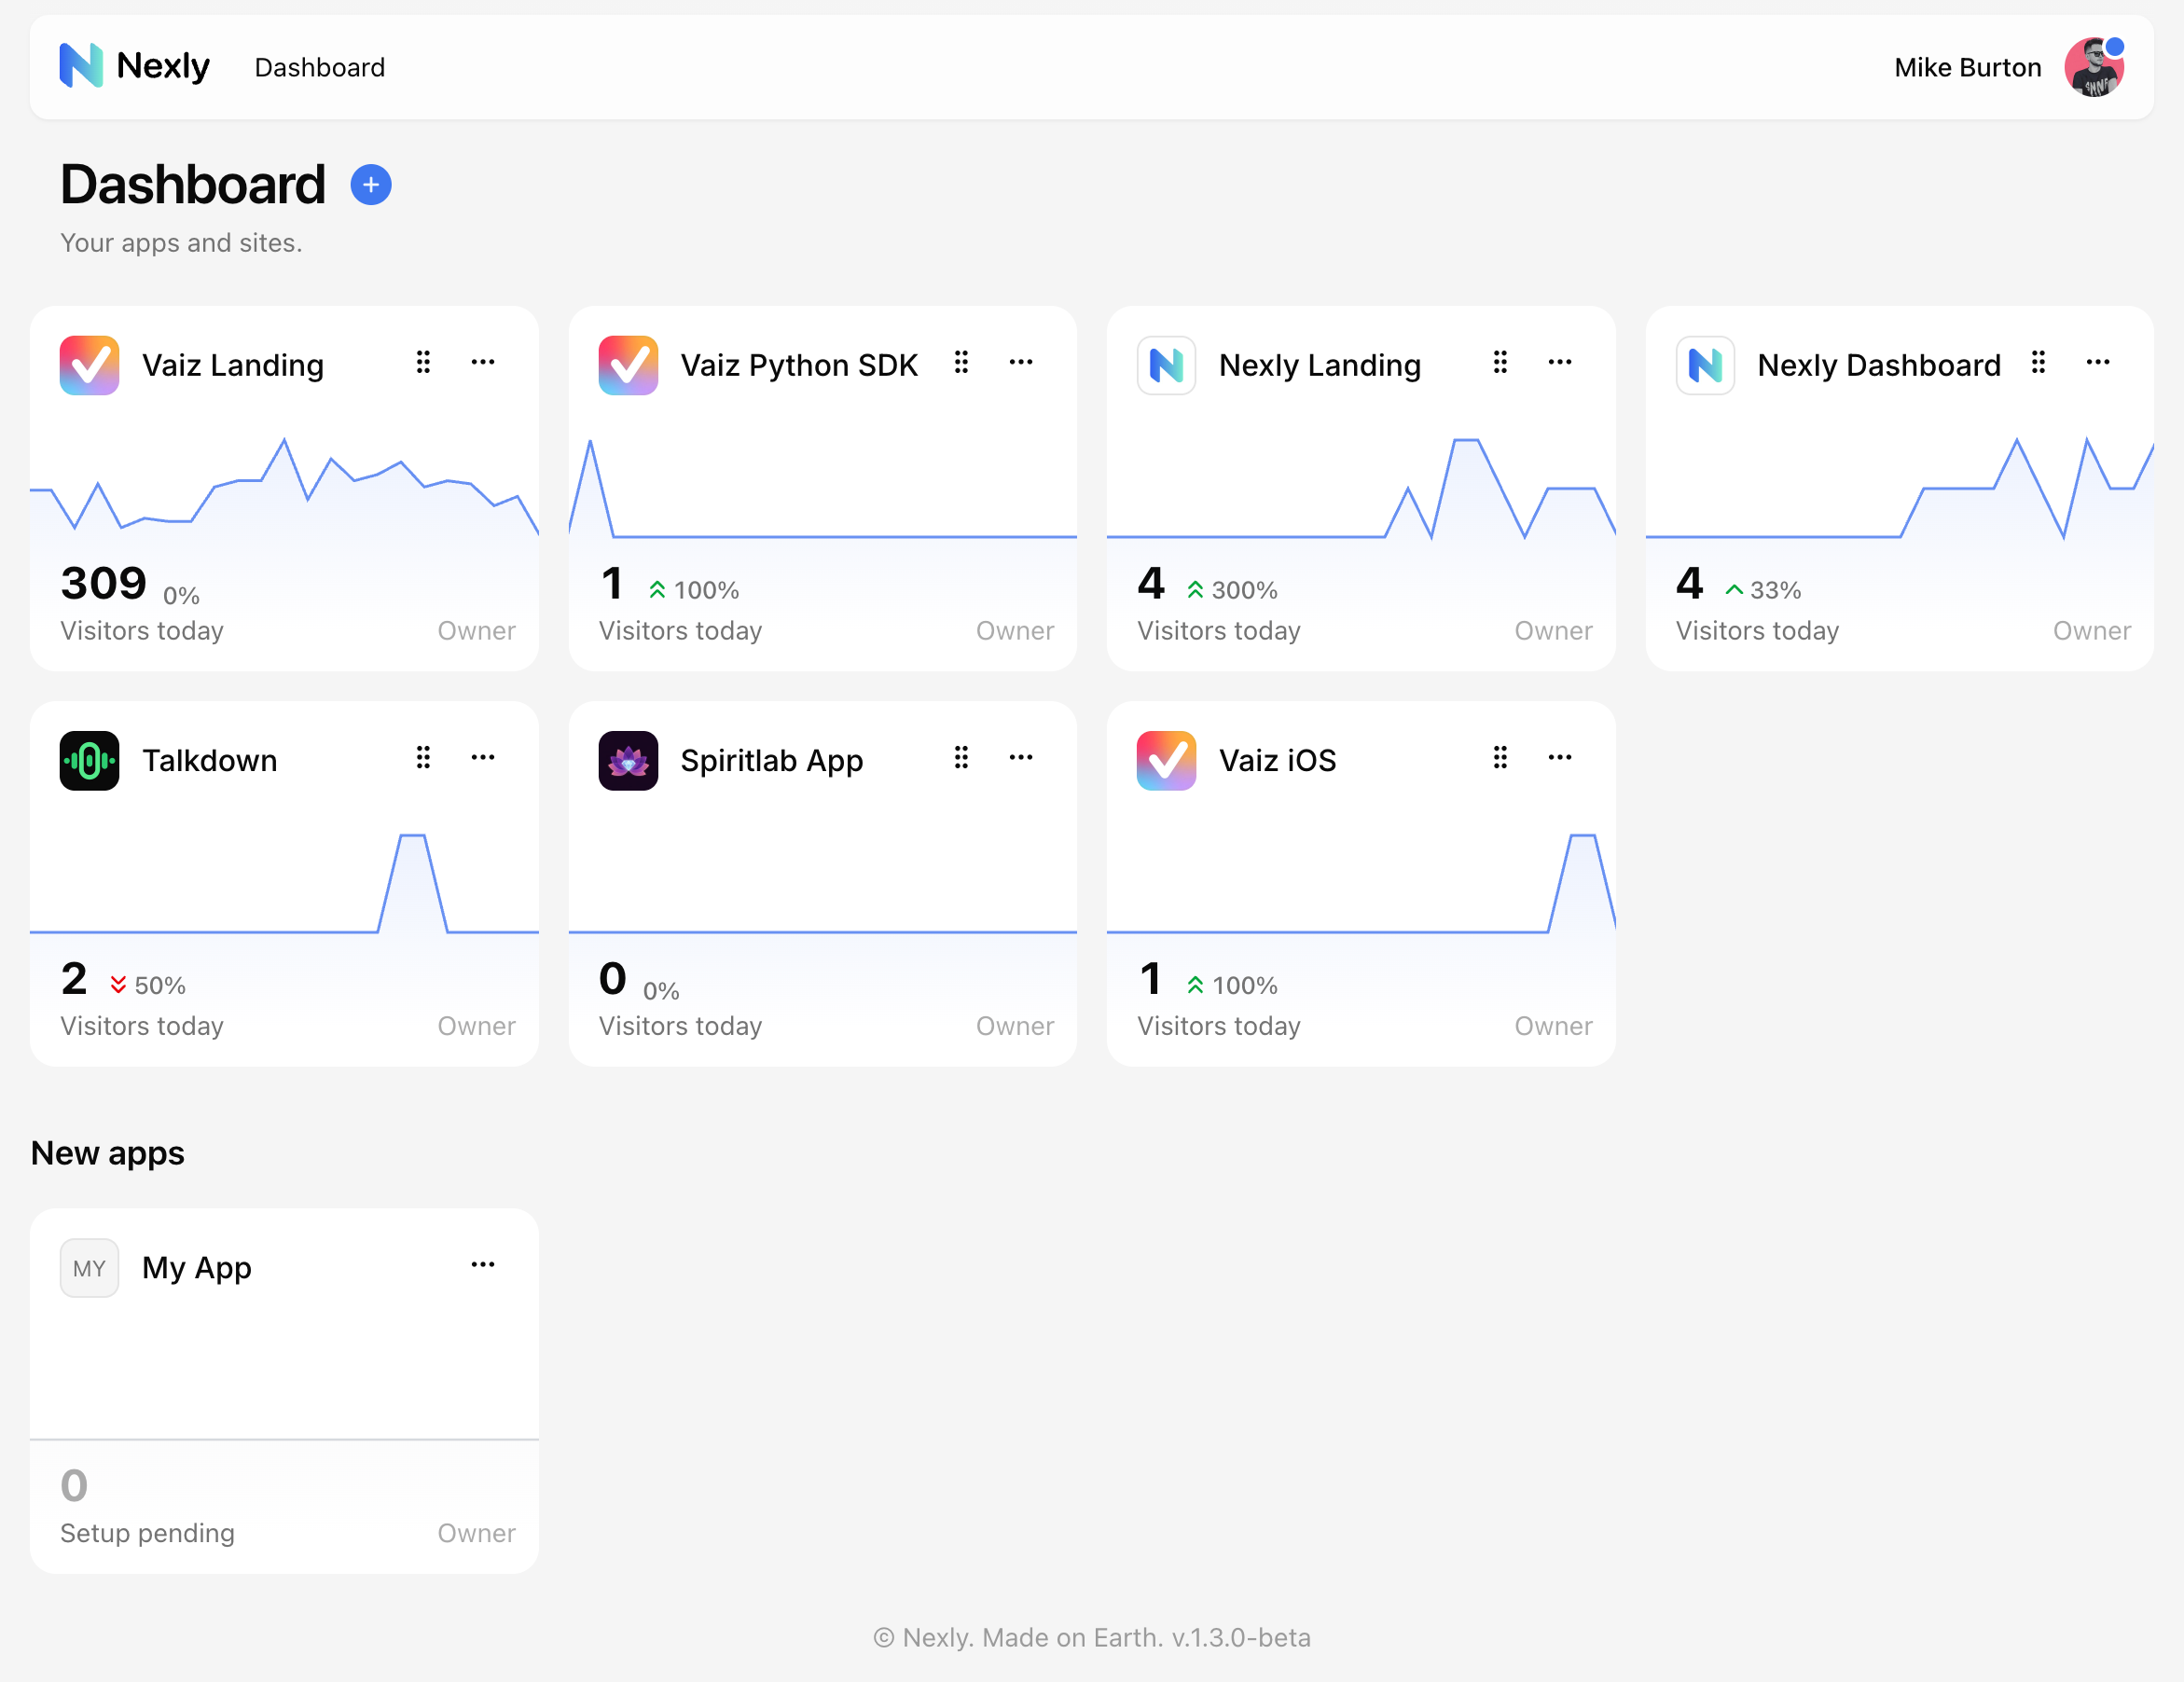
Property is a tracked app, site, or product surface. Each property has its own App ID, ingest key, allowed origins, analytics dashboard, reports, events feed, team members, and settings. All your properties live on the home Dashboard: each card shows today's visitors with a sparkline, and properties waiting for their first event sit under New apps with a Setup pending badge.
Ingest key is the credential used by SDKs to send events into a property. Keep it in the SDK configuration shown in the Installation settings. Rotate it if it is exposed somewhere it should not be.
Personal API token is a read-only account token for programmatic access to analytics data. It is different from an ingest key.
What Nexly tracks automatically
After the SDK is installed, Nexly can record:
- Pageviews and screenviews.
- Sessions, visits, and returning visitors.
- Engagement such as scroll depth, clicks, input focus, visibility, and active time.
- Acquisition fields such as channels, sources, campaigns, and UTM parameters.
- Device, browser, operating system, and client SDK.
- Country, region, and city when available.
- Bot, crawler, and AI referral signals.
You can add your own product actions with custom events.
Where to start
Create a property, install the SDK, and wait for the first event. The setup card checks automatically — once Waiting for the first event… switches to Successfully connected, open the dashboard and start with the headline metrics, visitors chart, and top pages.
For teams, invite teammates after data is flowing so they can see the same property with the right role.