Reports
Nexly can generate weekly and monthly reports for each property. Reports summarize the selected period and compare it with the previous period when enough data is available.
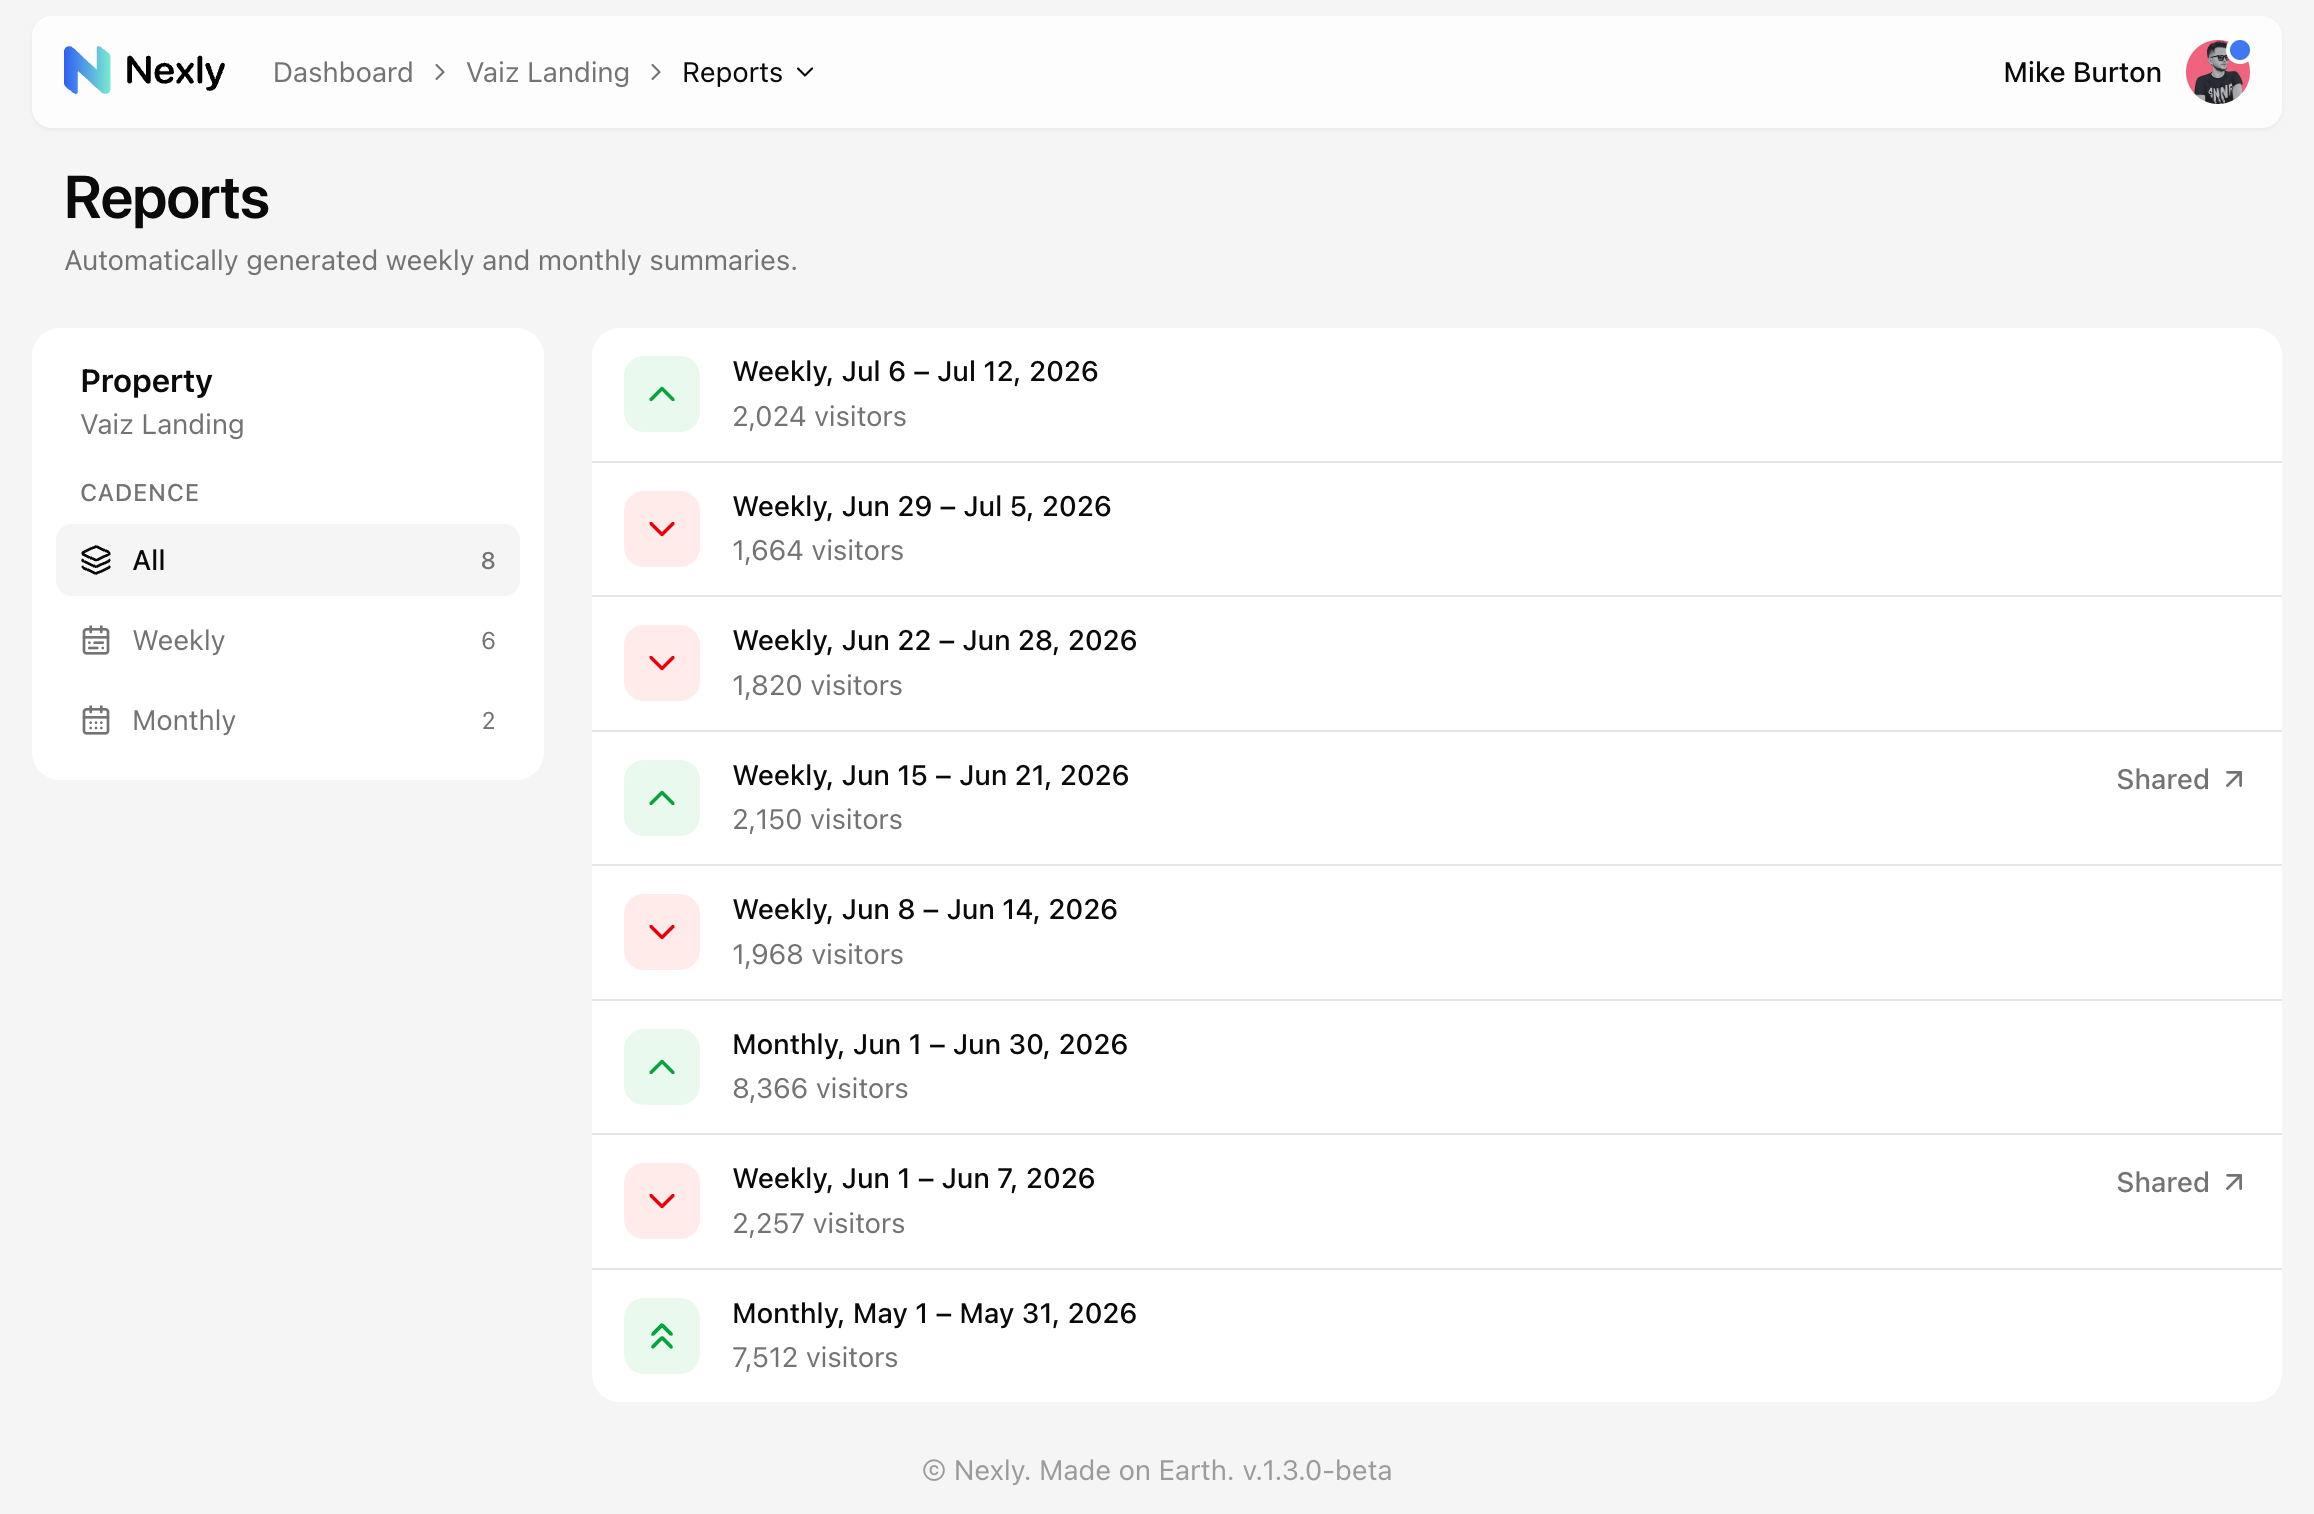
Reports can include:
- Headline metric changes.
- Top pages.
- Top sources (acquisition channels).
- Top countries.
- Top custom events.
Apps with no meaningful traffic may skip empty reports.
Reading a report
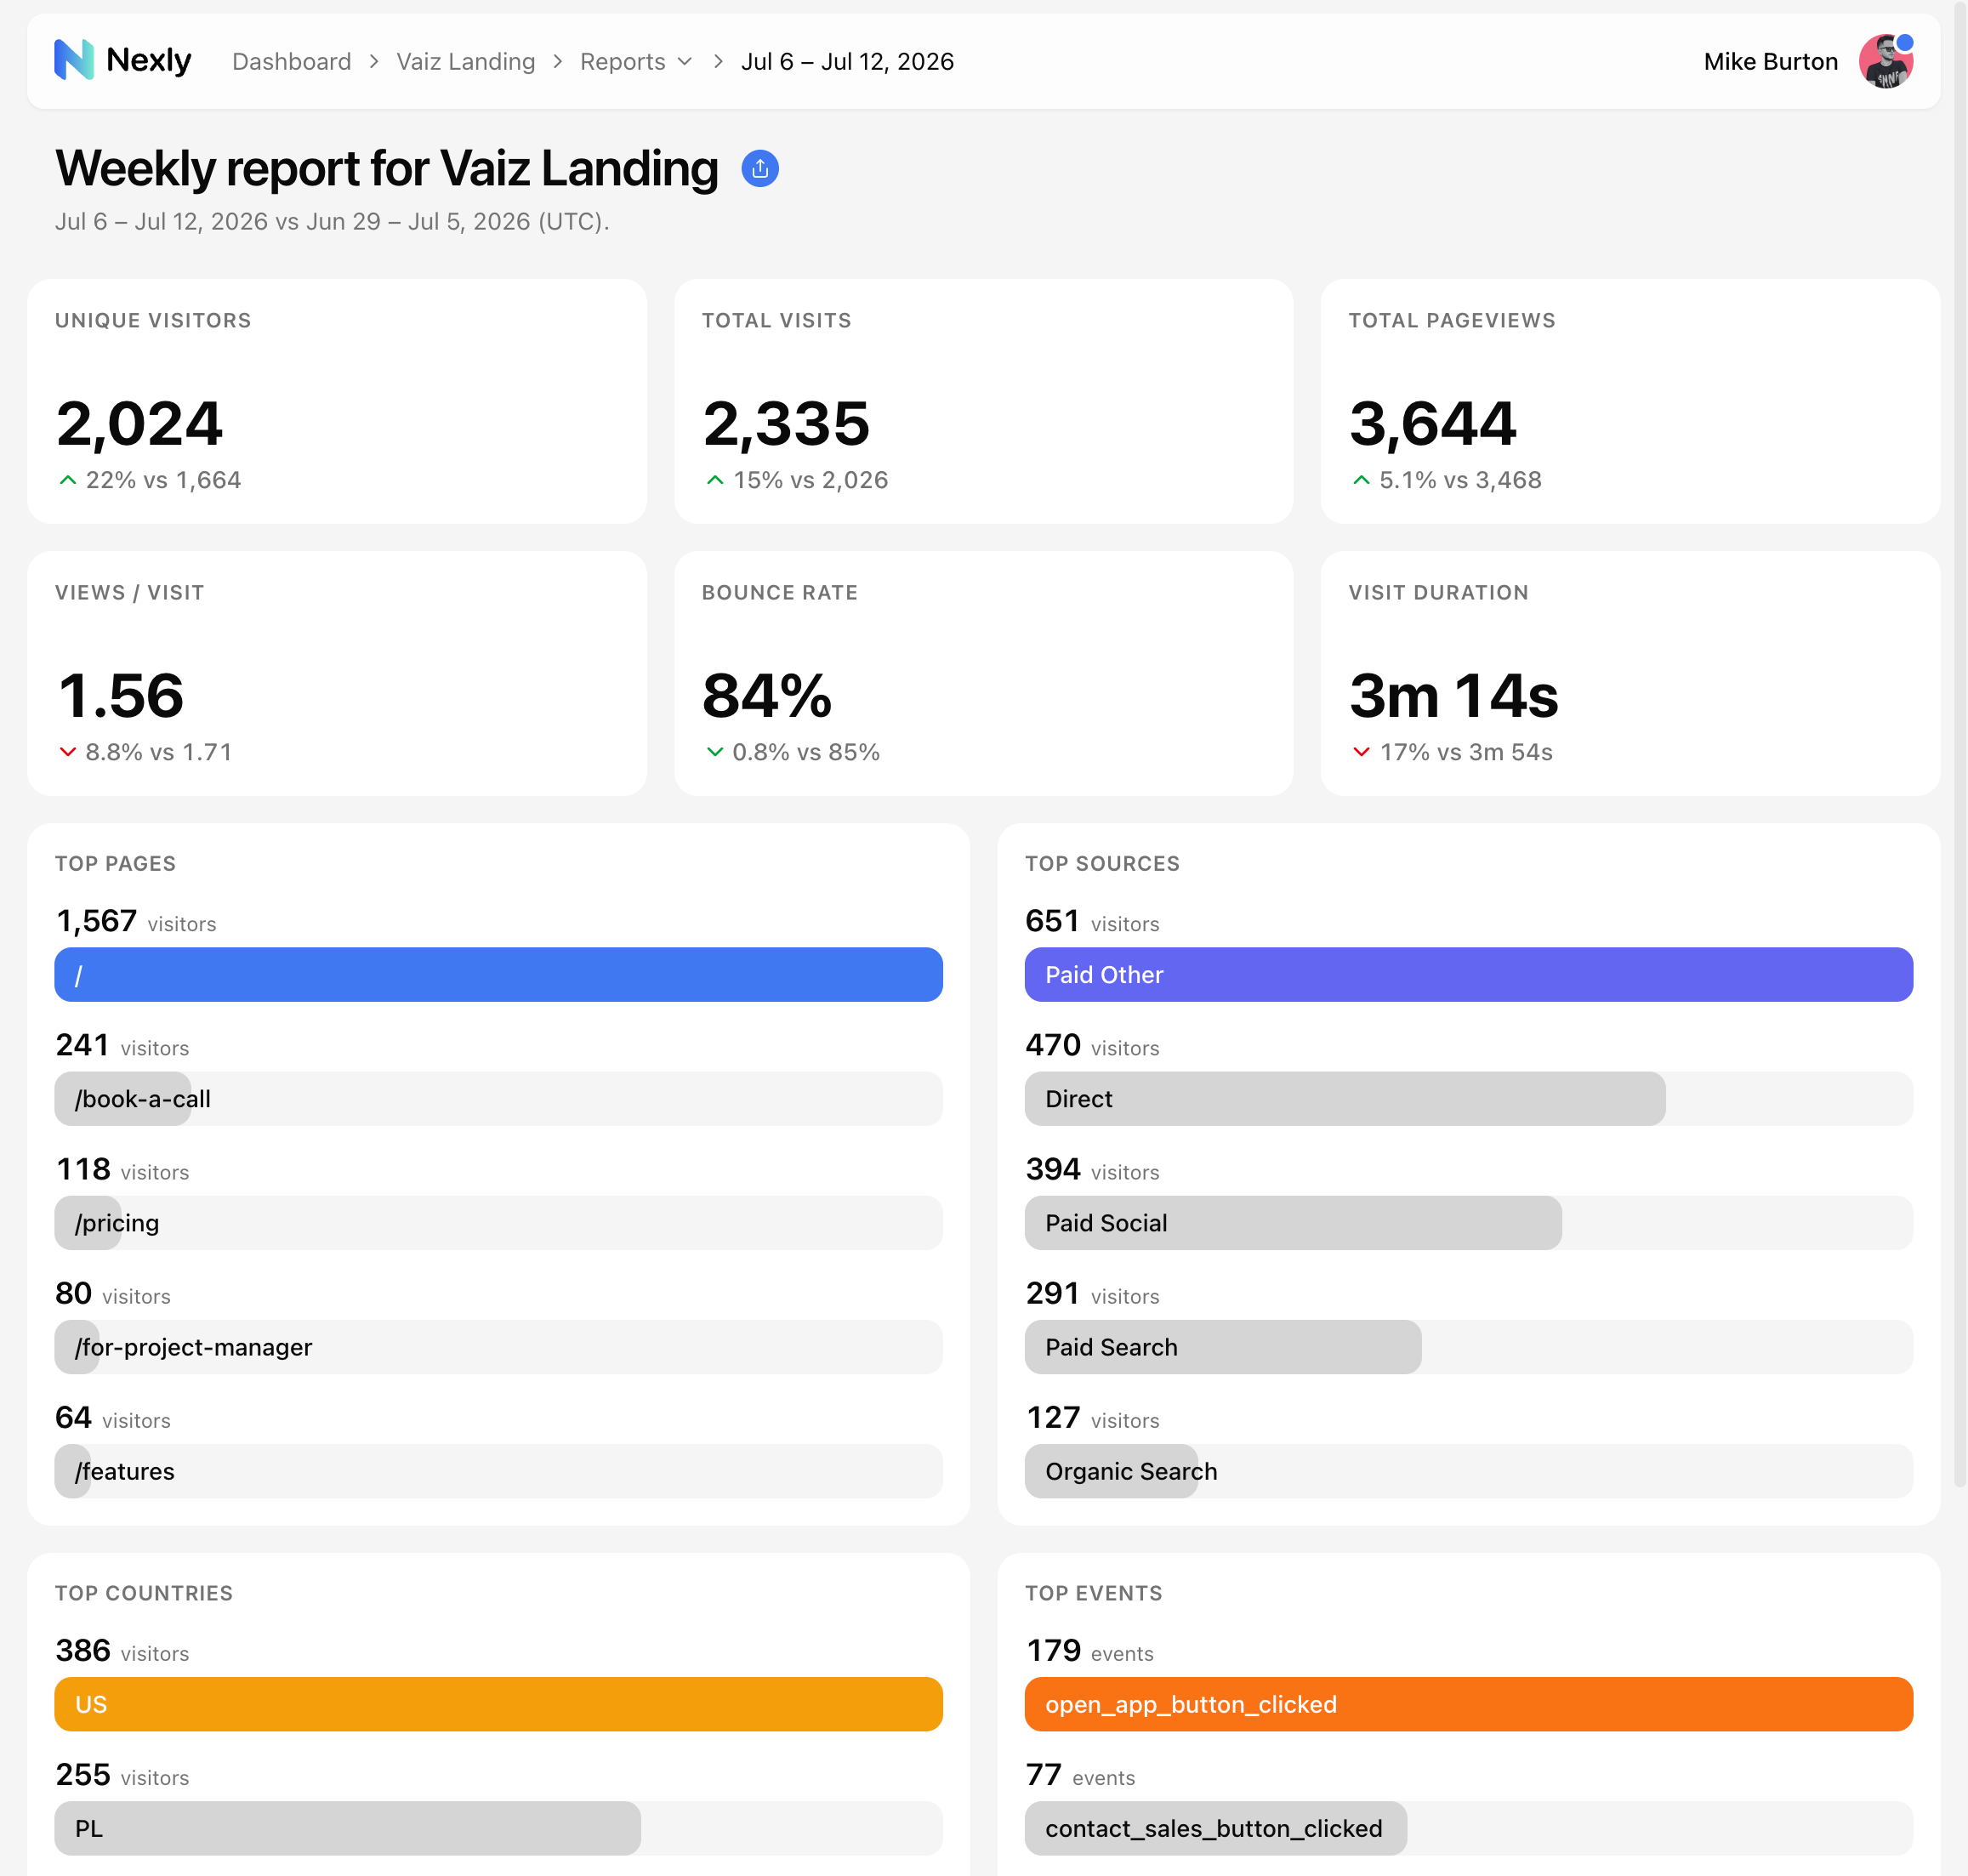
Start with the metric tiles, then review the breakdowns that explain the change. A traffic increase from one channel, country, page, or custom event is often more useful than the overall trend by itself.
Open the property dashboard when you want to continue investigating with filters and charts.
Explain in Insights
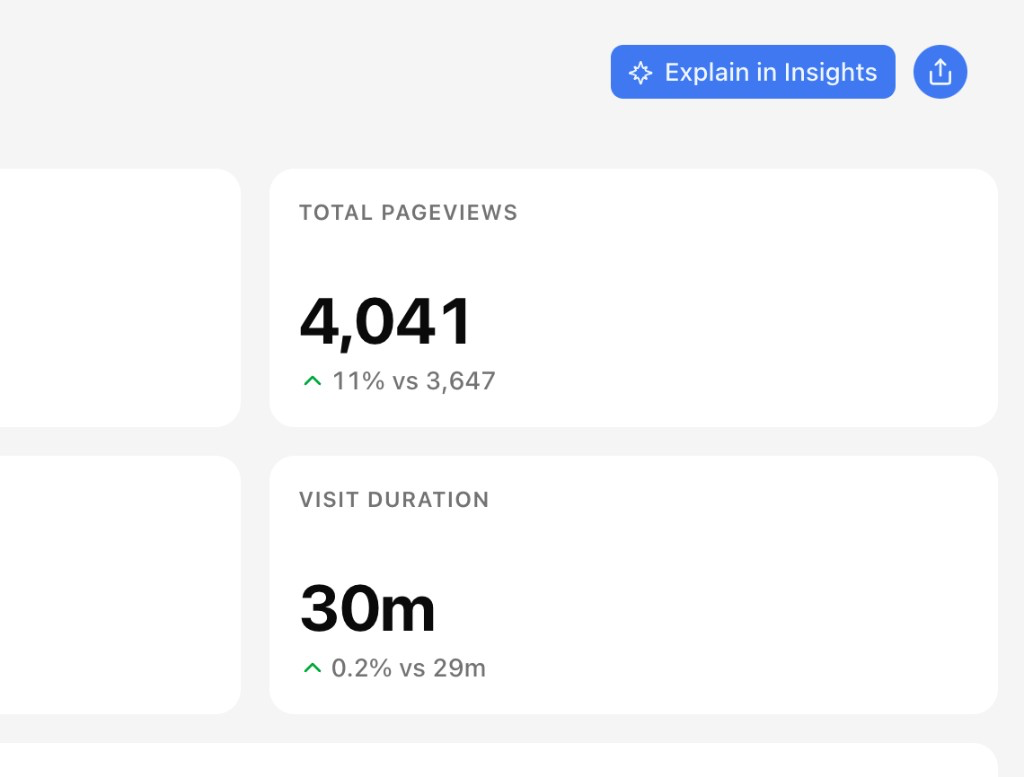
Open a weekly or monthly report and choose Explain in Insights in the header, next to the report actions menu. Insights starts with that report’s period and headline stats already in context, so you can ask why traffic moved and dig into sources, pages, and channels for the same window.
See Insights for how to continue the conversation, switch models, or change the app scope.
For spikes and drops detected outside reports, see Incidents and anomalies.
Sharing reports
Reports can be shared with a public link when sharing is enabled for that report. Use PDF export or browser print when you need a static version for a meeting or archive.
Public report links should be treated as shareable snapshots. If a link reaches the wrong audience, turn sharing off — the old link stops working immediately, and turning sharing back on issues a new one. See Report sharing.