Metrics glossary
Nexly turns raw events into visit and visitor metrics. Use this glossary when reading the dashboard, reports, anomalies, and exported data.
Unique visitors
Unique visitors counts distinct visitors in the selected date range. A visitor is identified by a visitor ID: browser and mobile SDKs generate one automatically, server-side events use the ID your code supplies, and in privacy mode nothing is stored on the device — visitors are derived on the server instead.
Use this metric to understand audience size.
Total visits
Total visits counts sessions. A session groups activity from one visitor into a browsing or app usage period.
Use this metric to understand how often people come back or start new sessions.
Pageviews
Pageviews counts web pageviews and mobile screenviews. React Native screenviews appear in page-style breakdowns so mobile and web navigation can be compared together.
Use this metric to understand total content or screen consumption.
Views per visit
Views per visit is pageviews divided by visits.
Use this metric to understand how deeply people move through the product during a session.
Bounce rate
Bounce rate is the share of visits that end without engagement. A visit bounces only when it records a single pageview or screen, performs no meaningful action, and lasts under ten seconds. Viewing a second page, firing a meaningful event, or staying longer than ten seconds all count as engagement and remove the bounce. This rule is the same on web and mobile — a visitor who reads one page for a minute is engaged, not bounced.
Lower bounce is usually better, but context matters. A documentation page can answer a question quickly, while a checkout flow may need deeper engagement.
Average visit duration
Average visit duration measures active session time. Nexly caps idle gaps so a forgotten browser tab does not inflate duration.
Use this metric to compare engagement across date ranges, channels, pages, or cohorts.
Comparison values
When compare mode is enabled, metric cards show the selected period against another period. For example, today can compare against yesterday-to-now, and month to date can compare against the same elapsed part of the previous month.
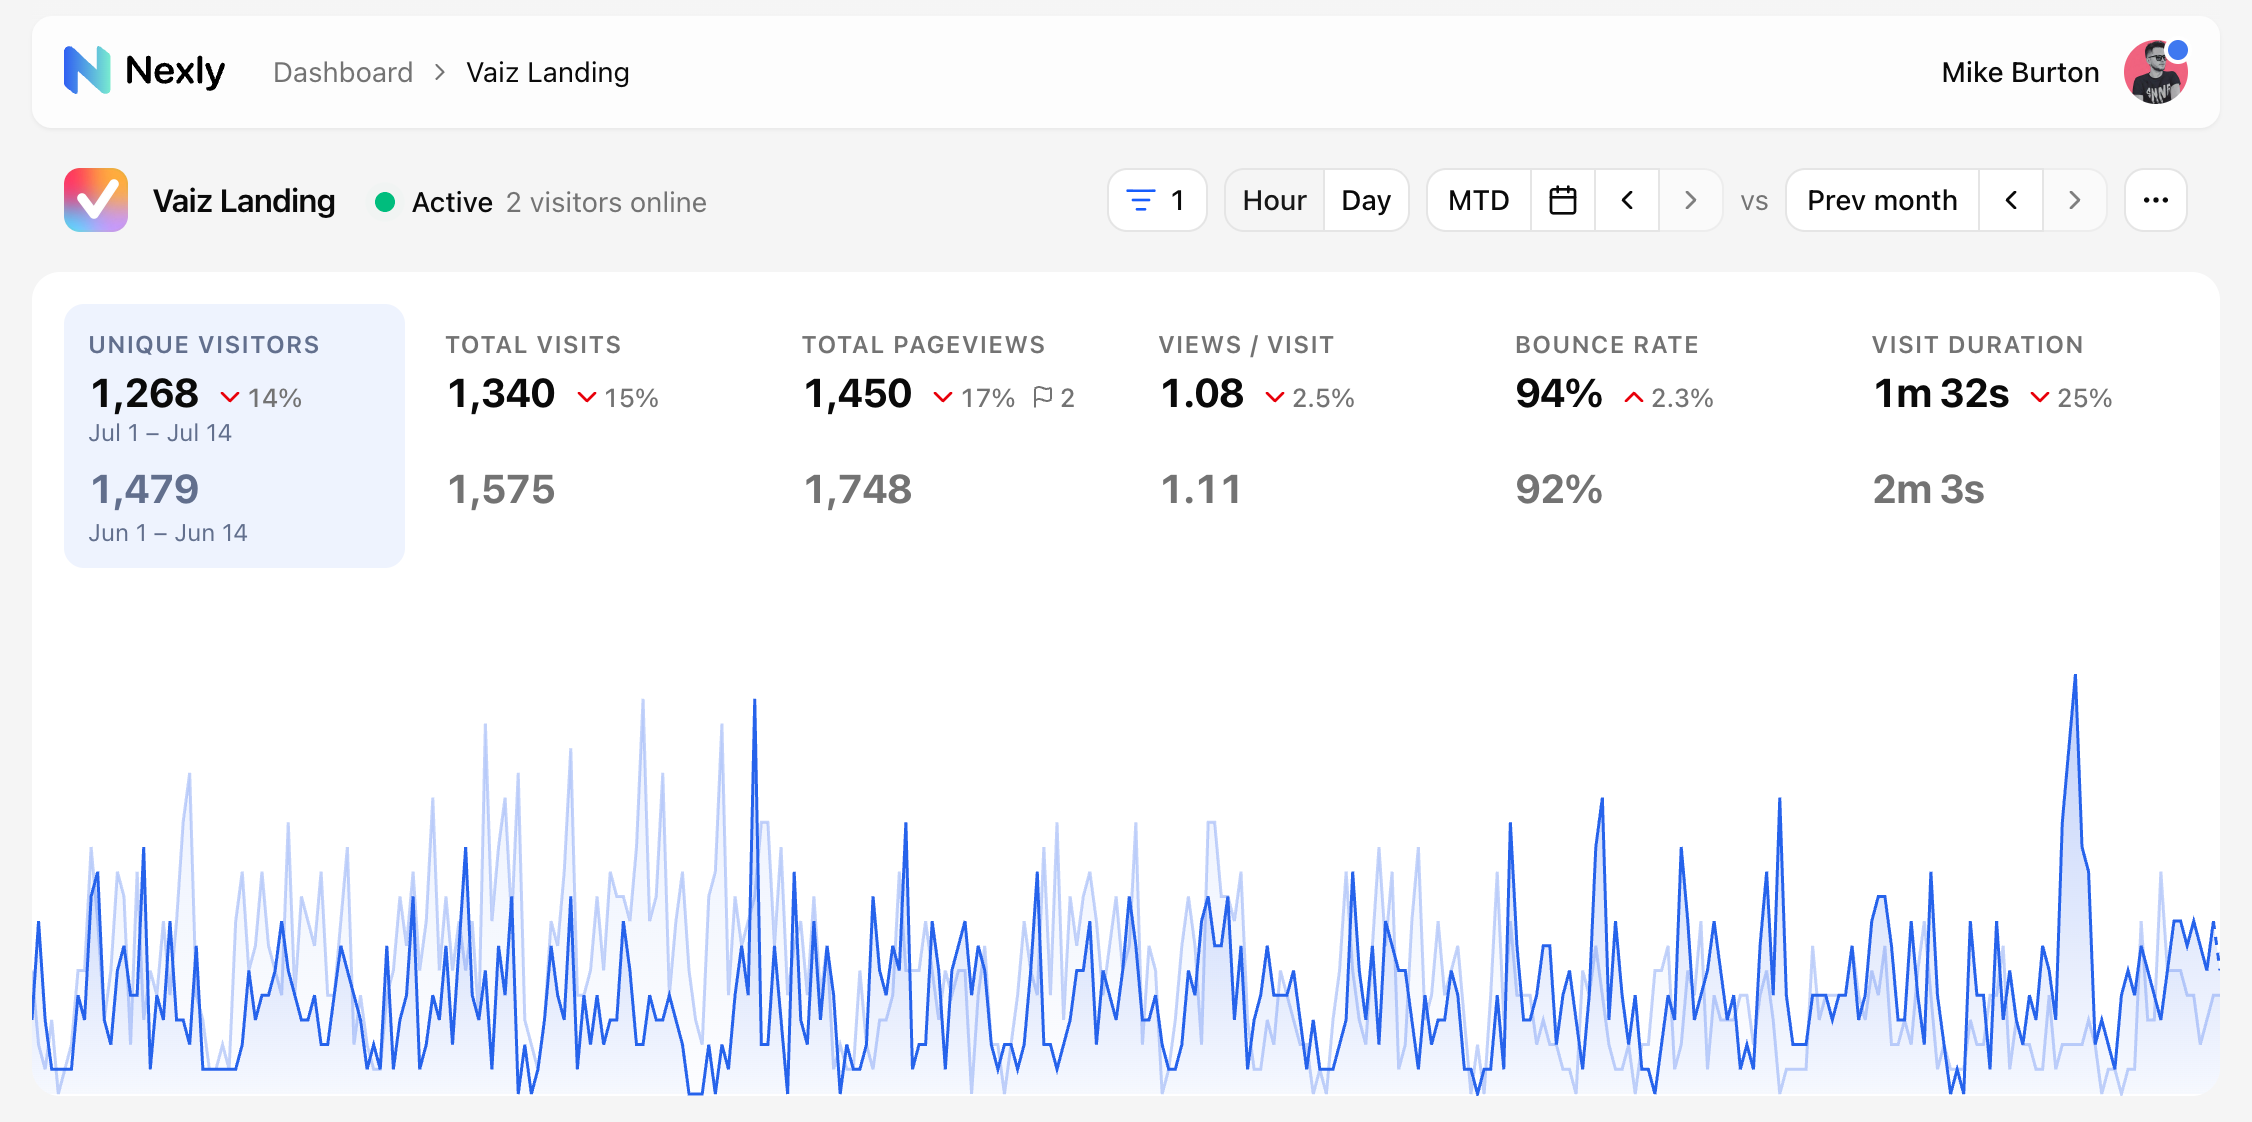
For metrics where lower can be better, such as bounce rate, read the label and trend color carefully.