Incidents and anomalies
Anomalies are unusual spikes or drops detected in analytics metrics. Treat them as incidents when they need investigation or follow-up.
What Nexly detects
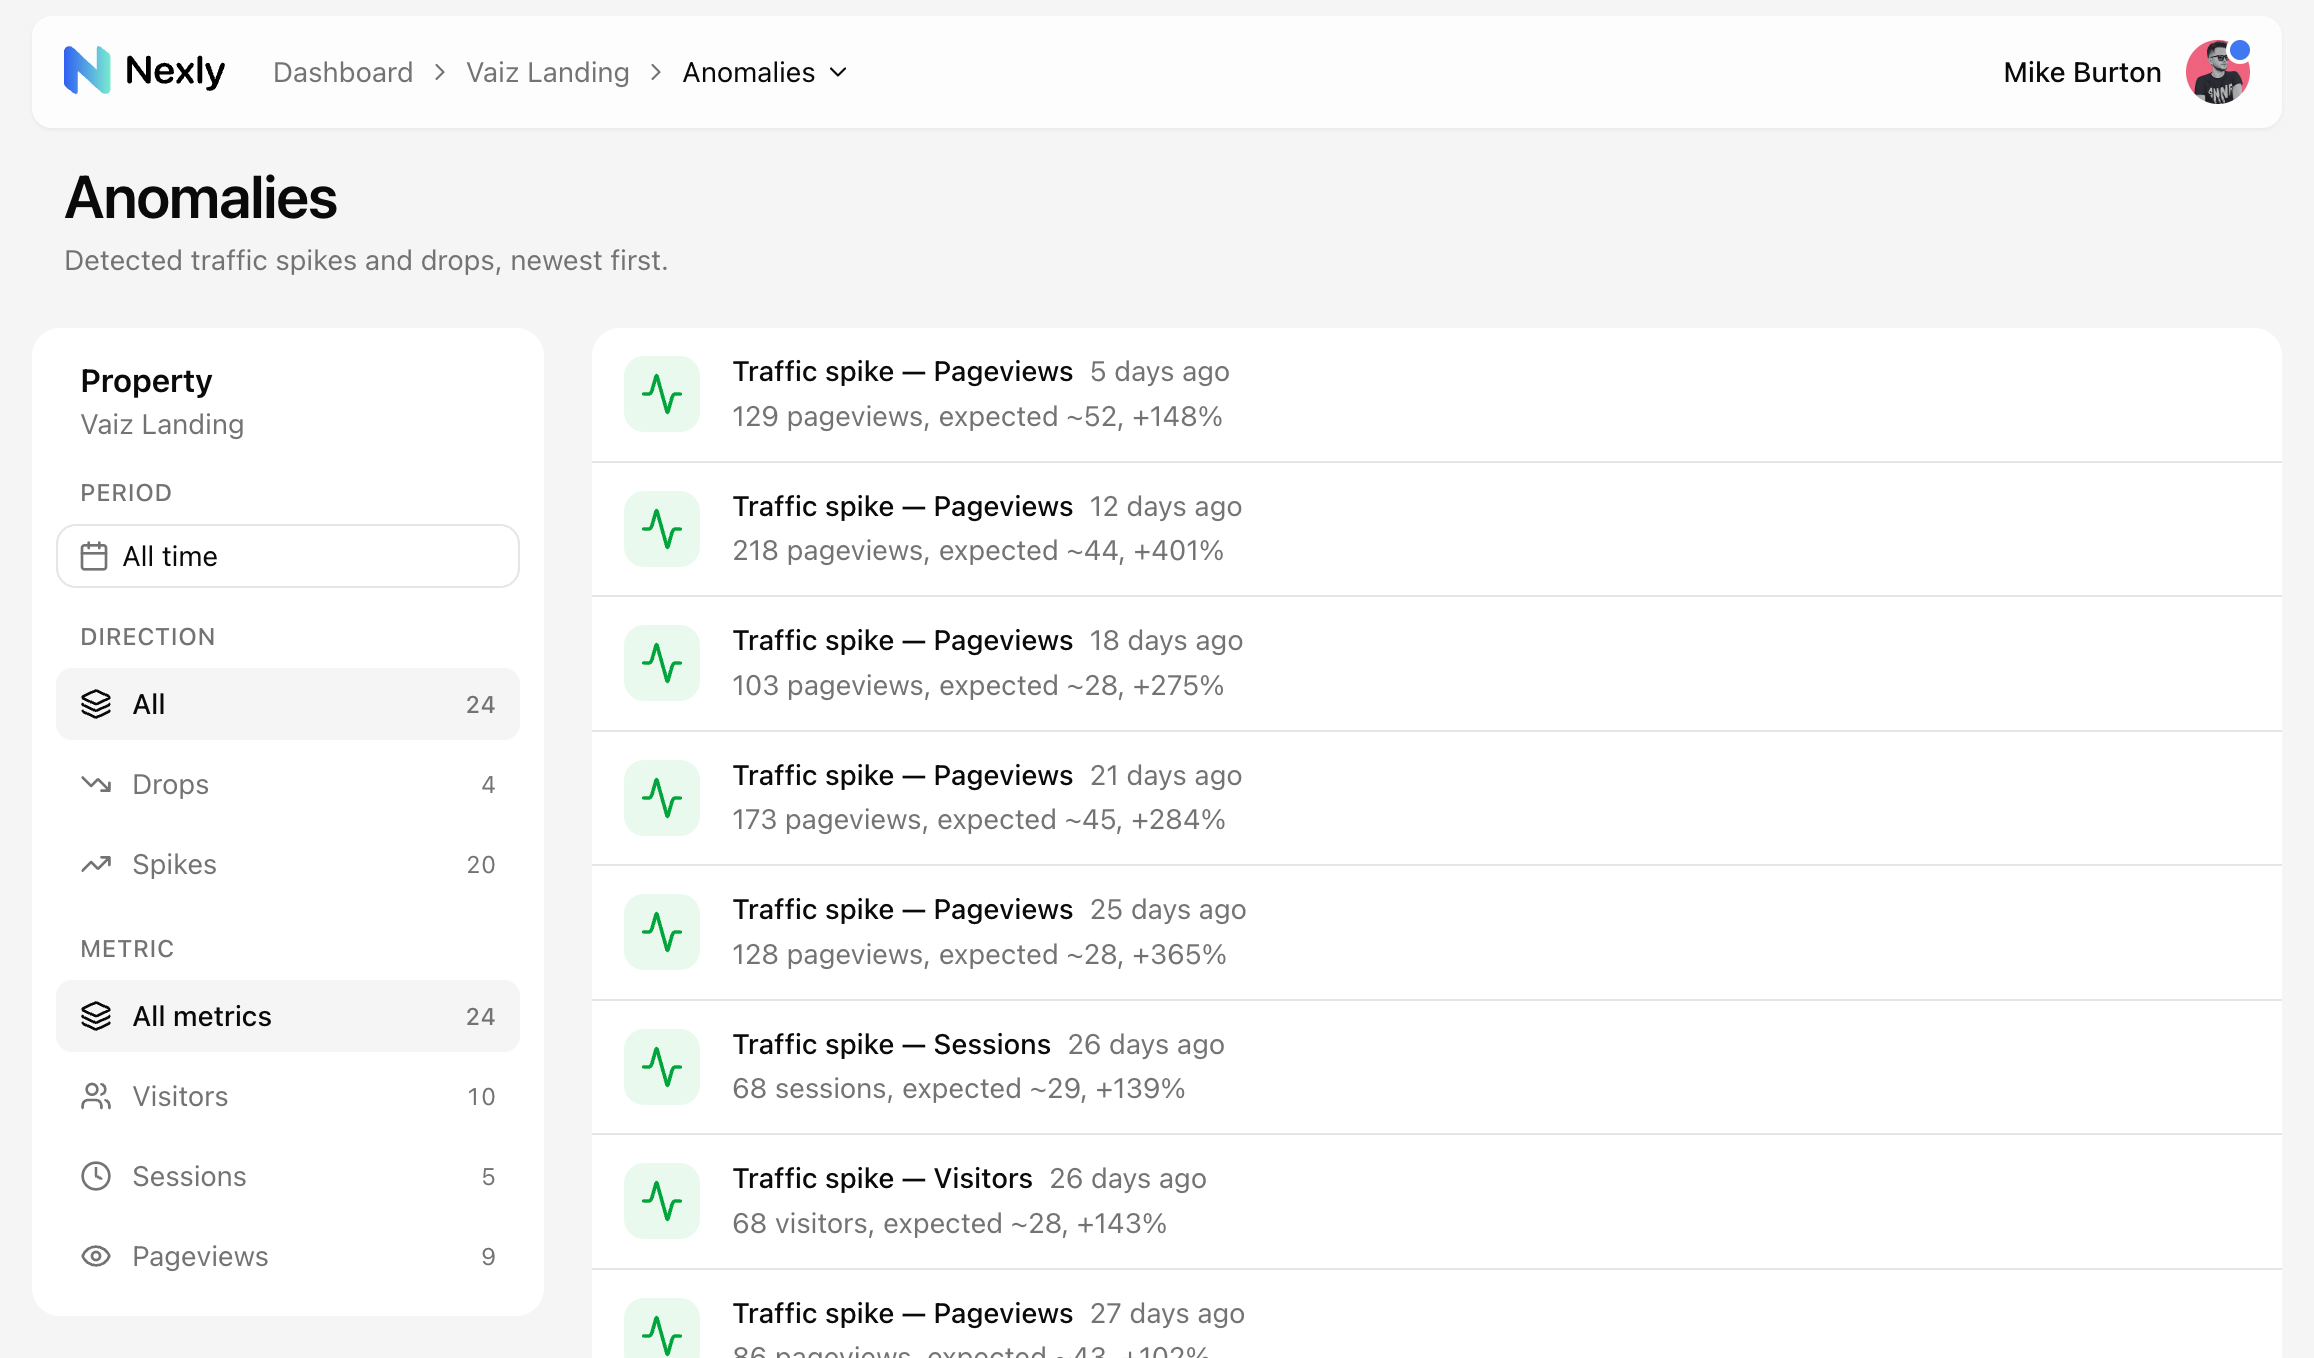
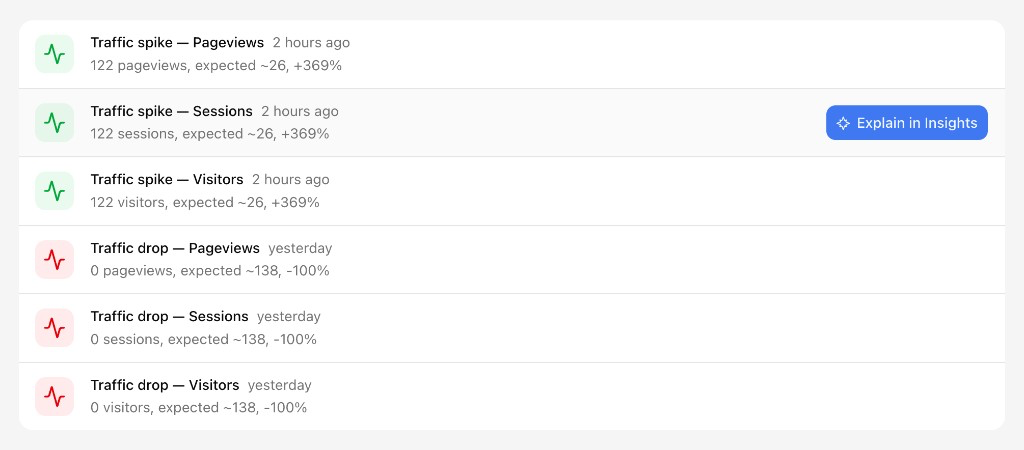
Nexly detects unexpected changes in visitors, sessions (visits), and pageviews. The Anomalies page can filter by period, direction (spikes or drops), and metric.
Detection works on two horizons. A single unusual hour — a sharp spike or a busy hour collapsing — is flagged as a traffic spike or traffic drop. A gradual decline that no single hour makes obvious, such as traffic running 30–50% below normal for half a day, is flagged as a sustained traffic drop with the window it was measured over (for example, the last 12 hours).
An anomaly includes:
- Direction: spike or drop.
- Metric.
- Observed value.
- Expected value.
- Percent change.
- Time window.
Where incidents appear
Anomalies can appear in:
- The property Anomalies page.
- The inbox.
- Email notifications, depending on preferences.
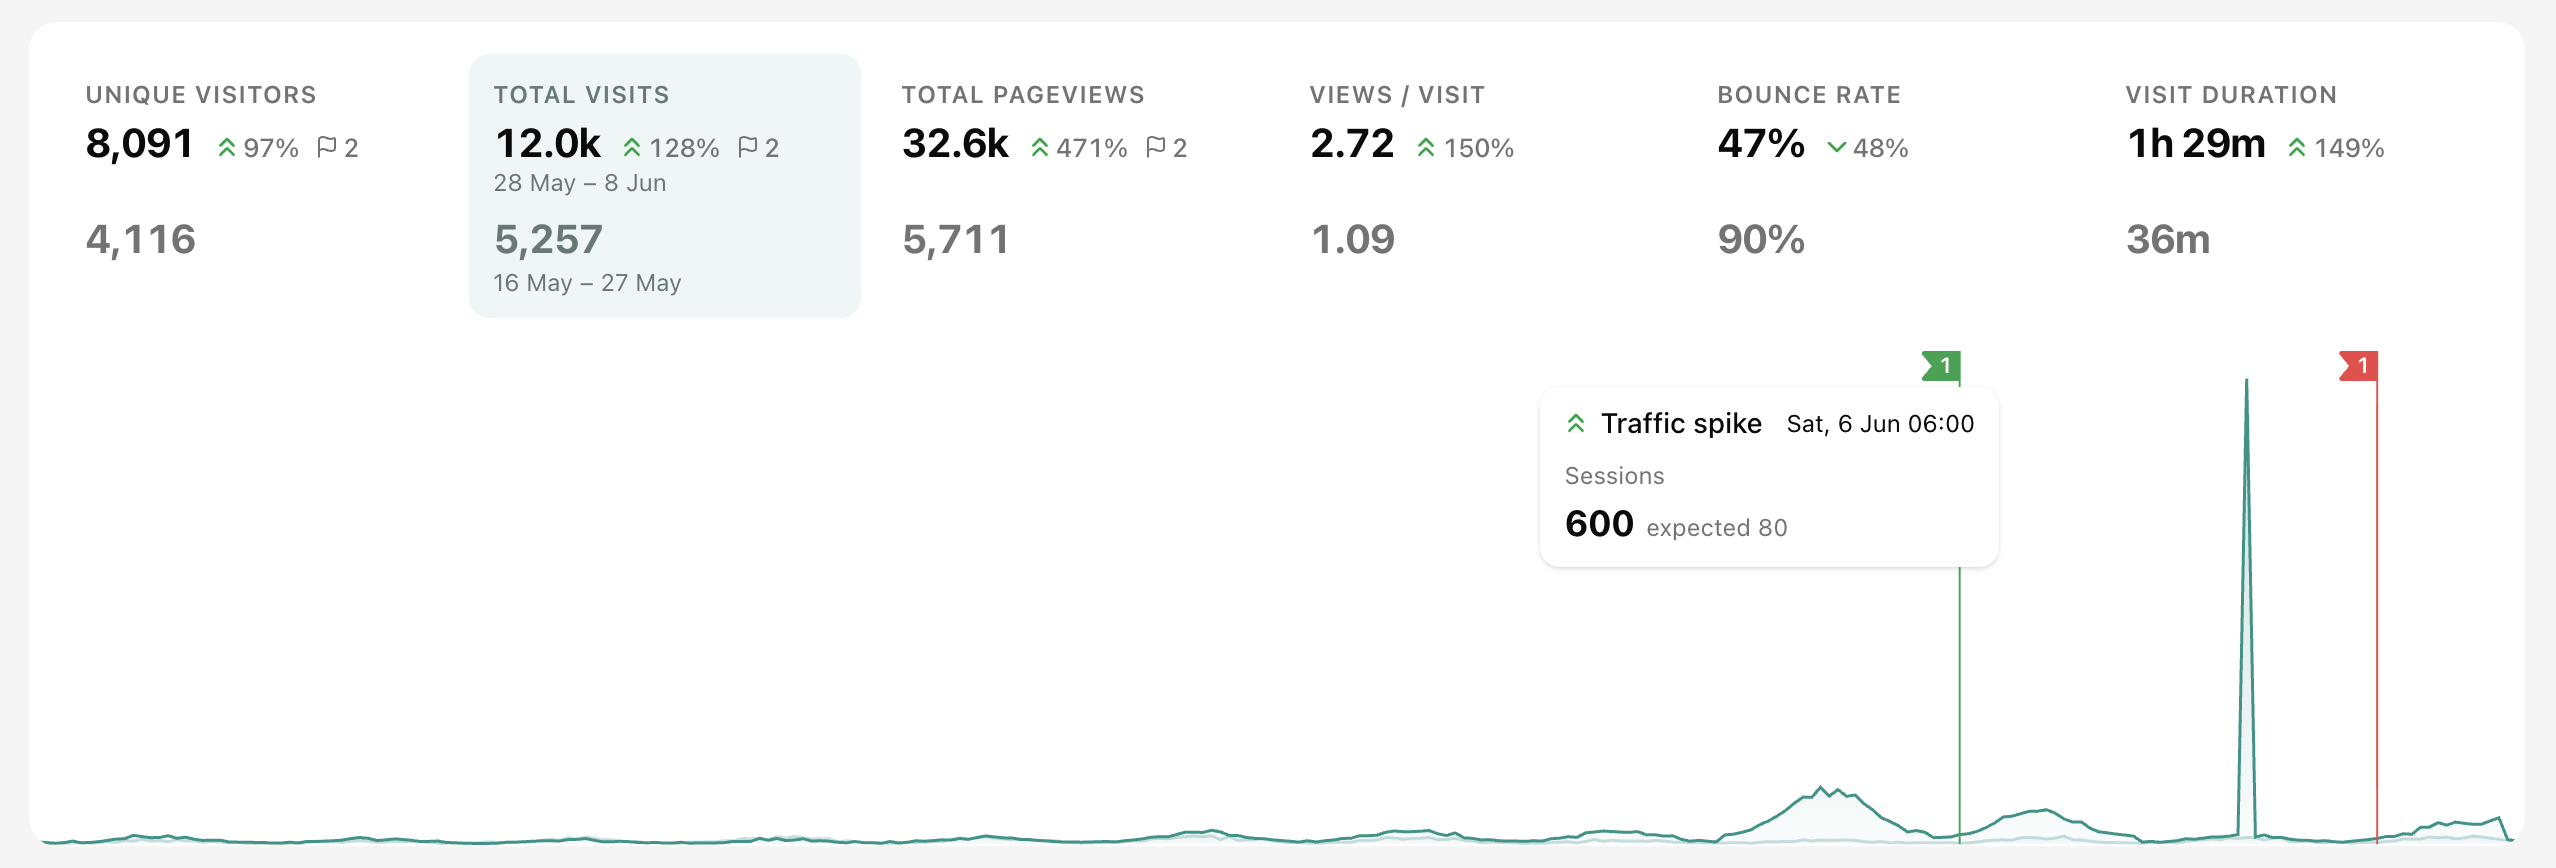
- Dashboard chart flags at the incident time.
- Metric-tab markers above the chart on the affected metric.
Incident markers are metric-specific. If the anomaly happened in pageviews, the marker appears on the pageviews tab; if it happened in visitors, the visitors tab shows it instead.
Open a chart flag to see the incident details: direction, metric, observed value, and what Nexly expected for that time window.
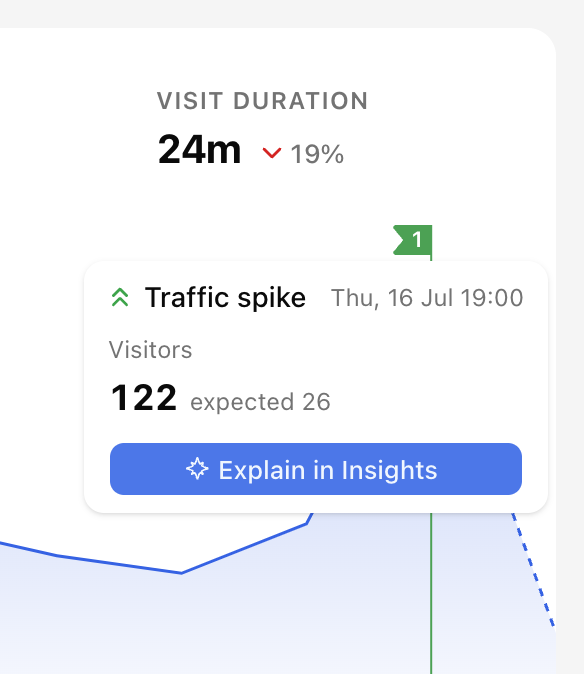
Explain in Insights
From an anomaly, choose Explain in Insights to open Insights with that incident already in context. Insights investigates the same hour — sources, pages, and channels — and returns a short explanation you can follow up on in chat.
The button appears:
- In the chart flag popover on the dashboard.
- On each row of the property Anomalies page (always visible on touch devices; on hover or focus on desktop).
Insights opens scoped to the current property and starts a fresh investigation for that spike or drop. See Insights.
Investigate an incident
Start from the anomaly deep link, or from Explain in Insights when you want the assistant to dig in first. The deep link opens the dashboard around the relevant metric and time window.
On the dashboard, select the metric tab that carries the incident marker. The chart flag shows where the unusual movement occurred in time, so you can compare the surrounding period with acquisition, pages, geography, technology, custom events, and bot activity.
Then check:
- Acquisition changes: did one source, channel, or campaign move?
- Page changes: did one entry page or exit page dominate?
- Geography: did traffic shift to a country or region?
- Technology: did one browser, device, or SDK client behave differently?
- Custom events: did product actions rise or fall at the same time?
- Bot activity: did crawler or AI traffic explain the change?
Marking follow-up
Use your team's normal incident process for notes, ownership, and resolution. Nexly helps identify and inspect the signal; it is not a replacement for operational incident tracking.
Notification noise
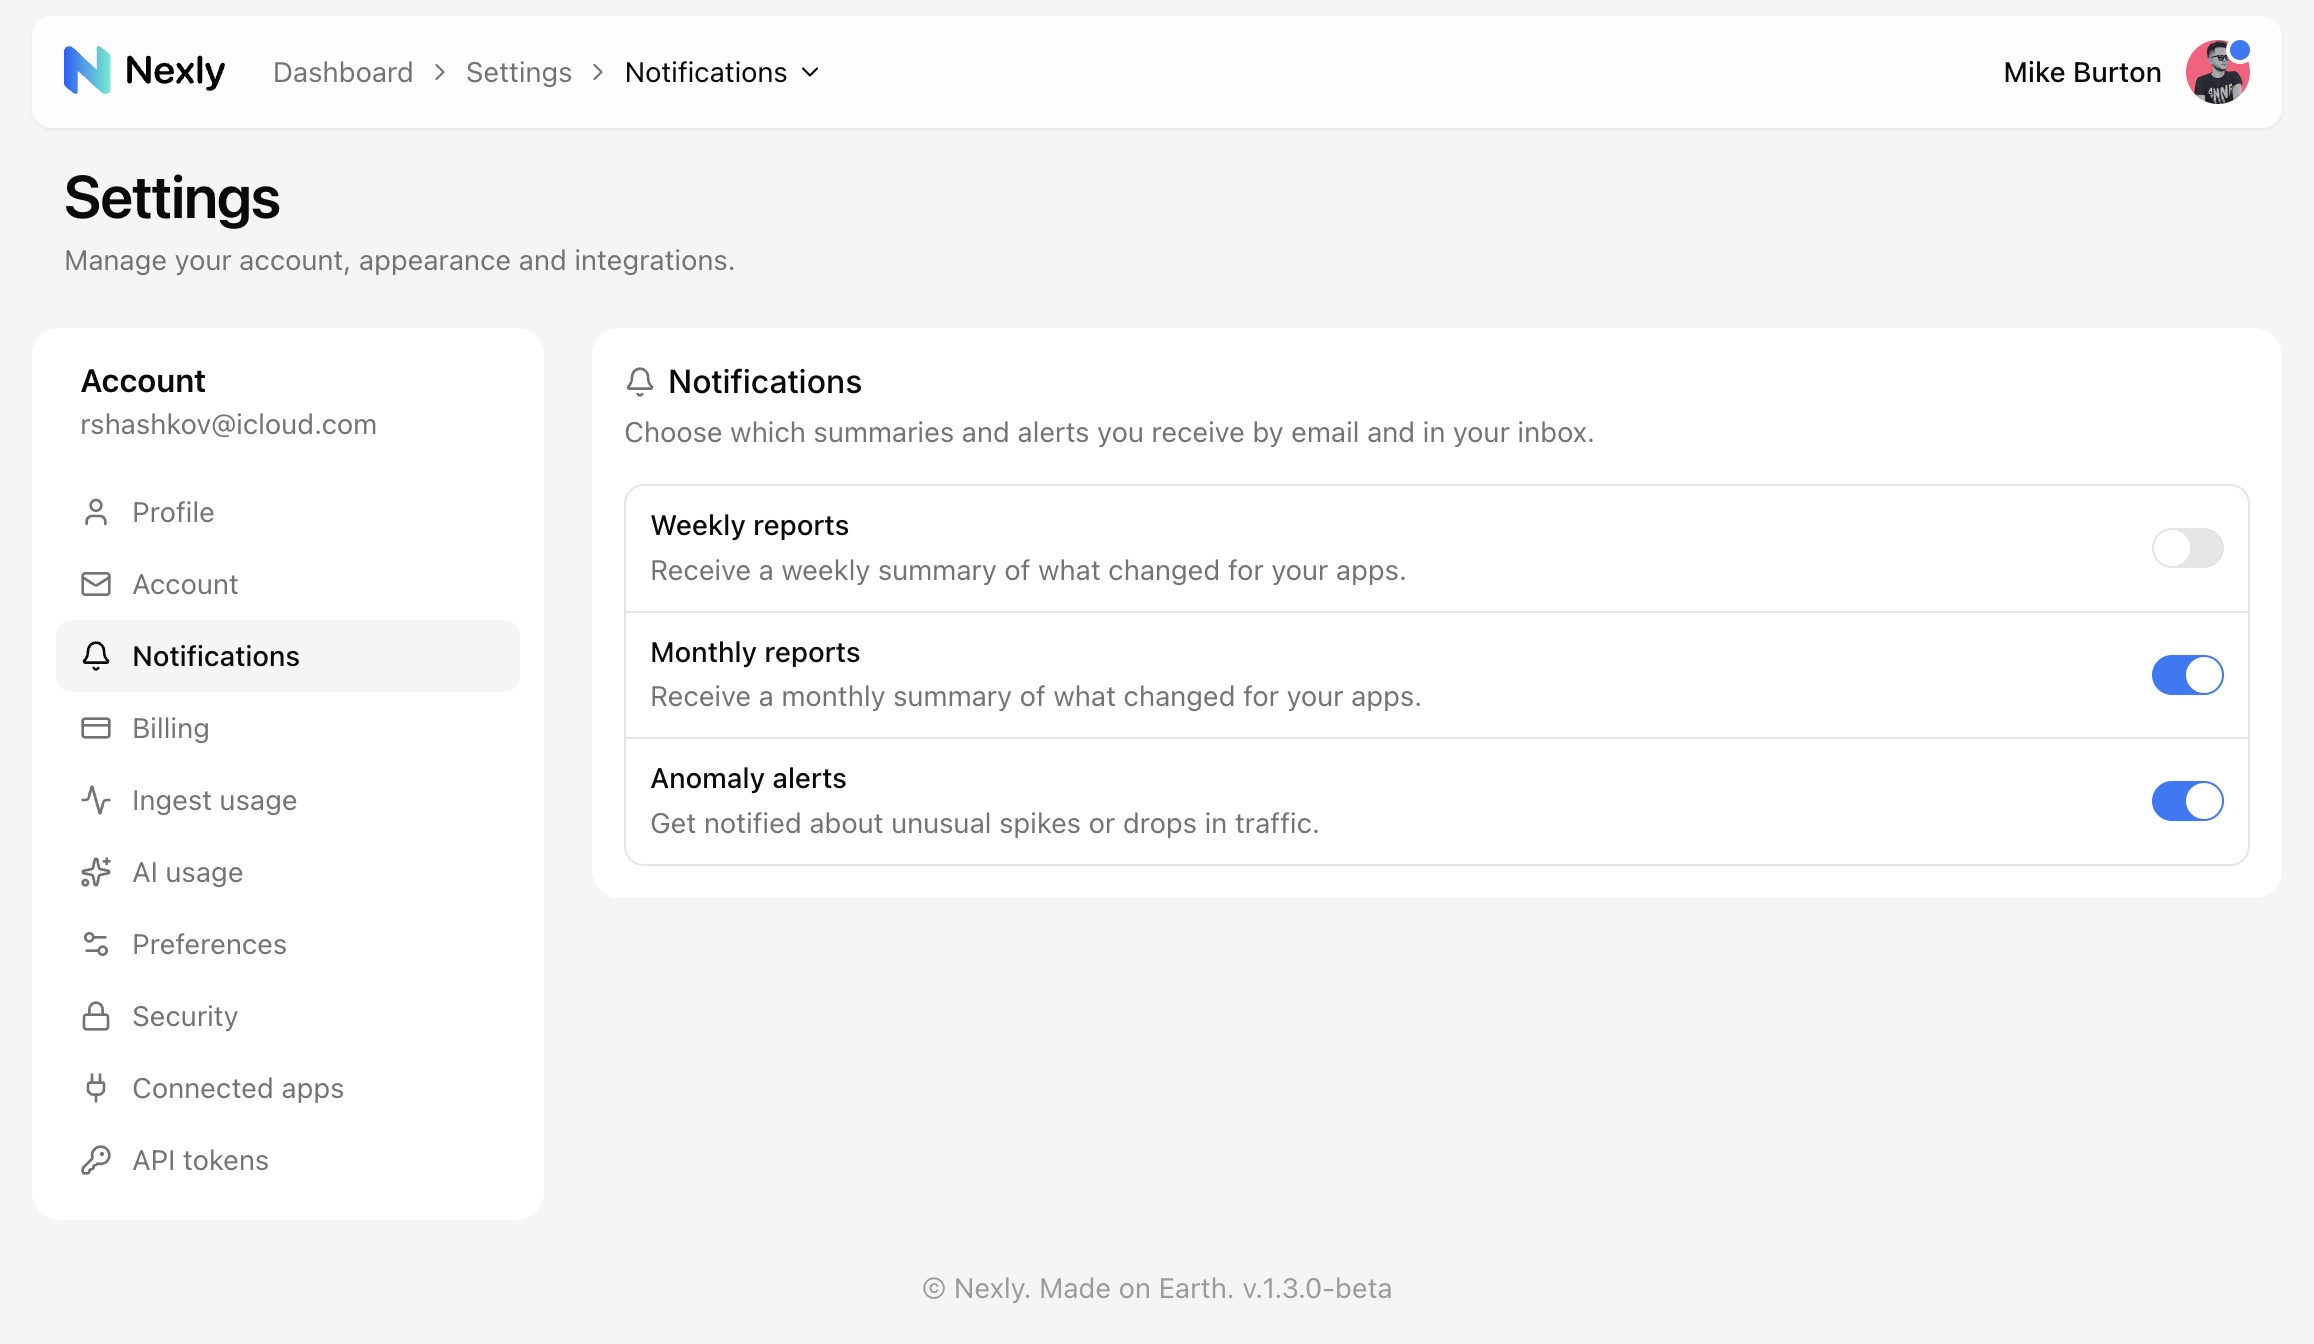
If anomaly notifications are too noisy, turn off anomaly alerts in your notification preferences. The toggle is personal and applies across all your properties — alerts cannot be muted per property.
Weekly reports, monthly reports, and anomaly alerts each have their own toggle in Account settings → Notifications.