Filters and saved views
Dashboard filters help you answer focused questions without leaving the property dashboard. Click values in widgets, or use the filter controls in the toolbar, to narrow the data.
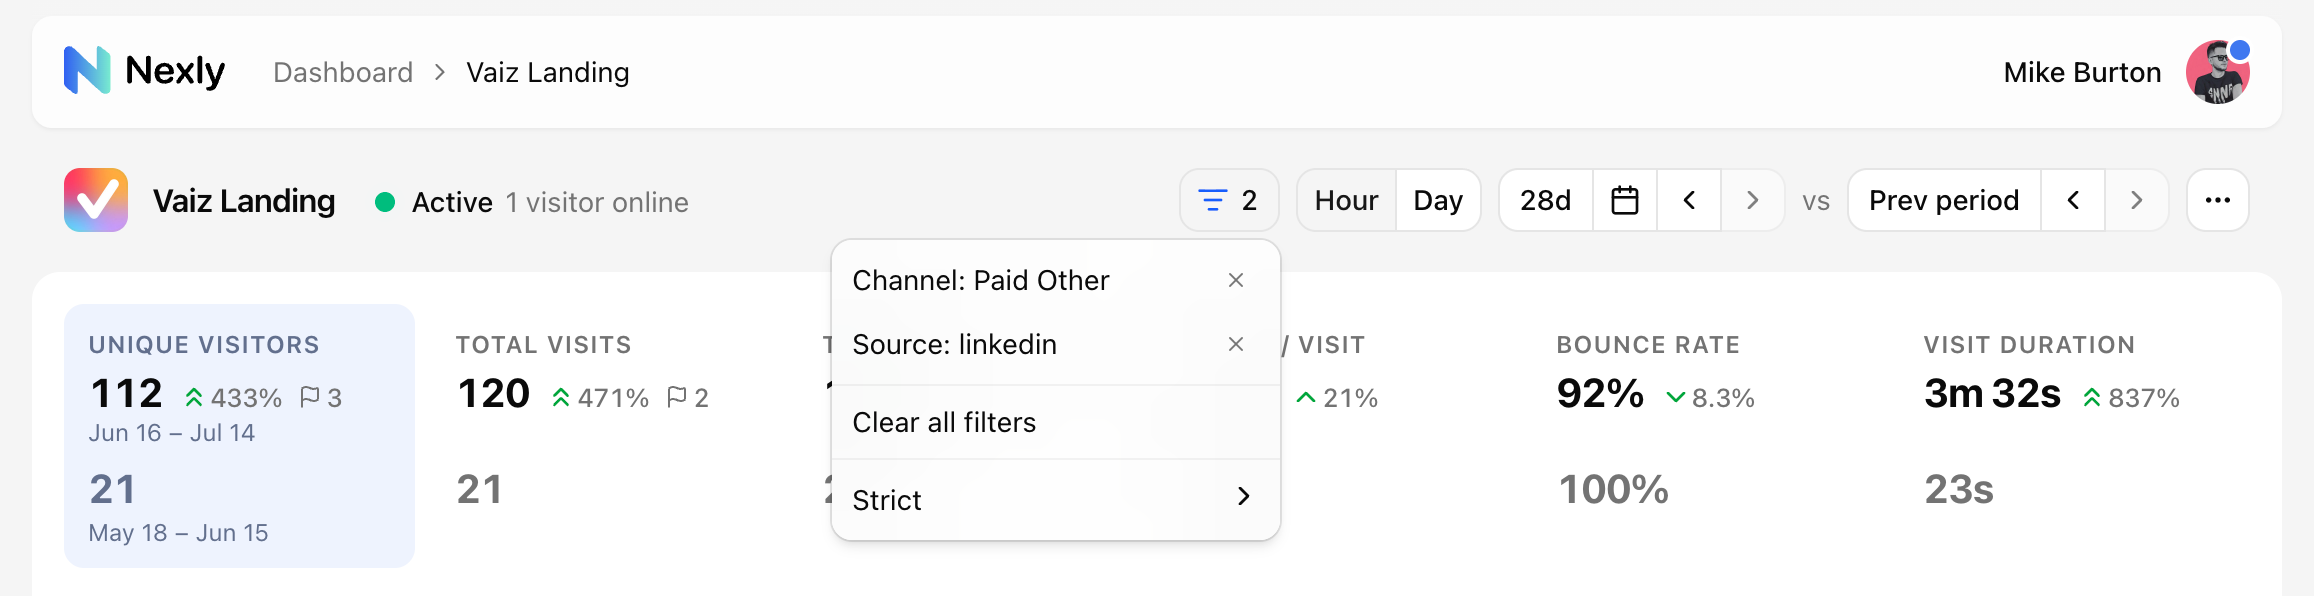
The filter button in the toolbar shows how many filters are active. Open it to review the current filters, remove individual values, or clear everything at once.
Filter modes
Nexly has three filter modes: Strict, Cohort, and Exclude. Switch between them from the same filter popover.
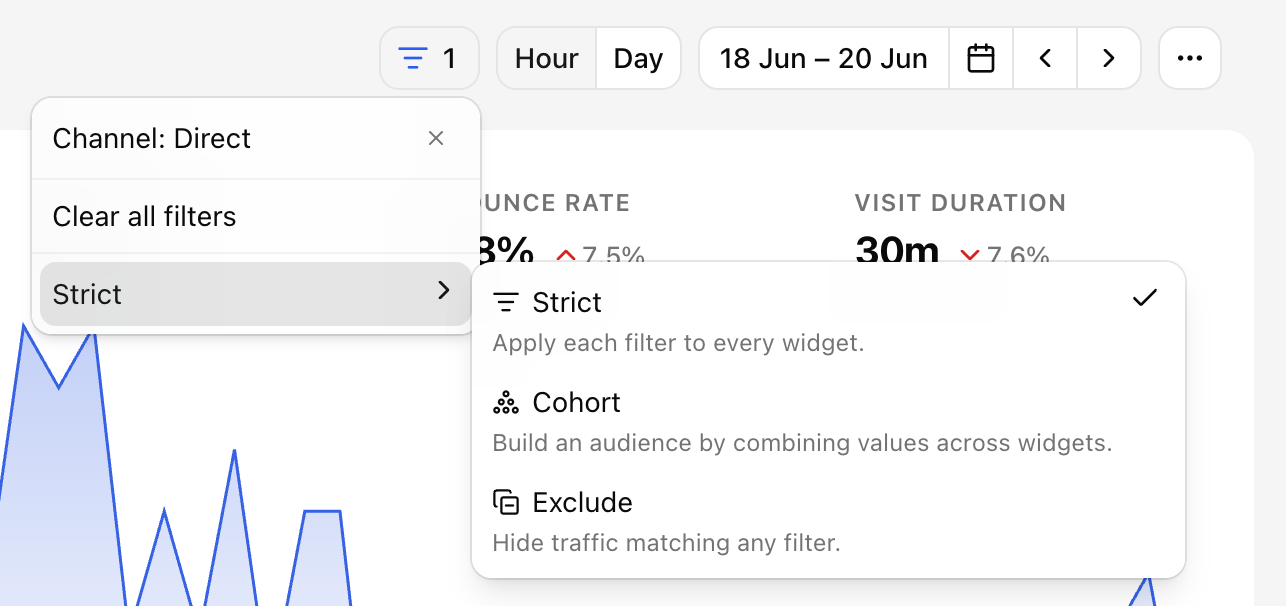
Use Strict mode when you want every widget to show only the exact intersection of selected values.
Example: show only traffic that is United States, Safari, and Organic Search at the same time.
Use Cohort mode when you want to define an audience, then see how that audience behaves across the rest of the dashboard.
Example: select visitors from the United States and Canada who visited /pricing, then inspect their acquisition sources, devices, custom events, and top pages.
Use Exclude mode when you want to hide traffic instead of selecting it. Every value you click is removed from the whole dashboard.
Example: exclude your home country and direct traffic to focus on everything else.
Clicking widget values
Many rows and chart values can be clicked:
- Countries, regions, and cities.
- Pages.
- Browsers, operating systems, devices, and SDK clients.
- Acquisition channels, sources, campaigns, and UTM values.
- Custom events and custom property values.
Click once to add a filter. Click again to remove it.
How Cohort mode feels
In Cohort mode, the widget where you are building the filter stays broad enough to add more values. Other widgets update to describe the selected cohort.
For example, if you filter by country, the countries widget can still show other countries so you can add or remove them. The pages and acquisition widgets update to show what the selected visitors did.
How Strict mode feels
In Strict mode, every widget applies every selected filter. This is useful when you need an exact slice and do not want the source widget to stay broad.
Strict mode is often best for audits, exports, and precise follow-up questions.
How Exclude mode feels
In Exclude mode, clicking a value hides matching traffic everywhere instead of focusing on it. The excluded value stays visible in its own widget — dimmed, with a small ban icon — so you can click it again to bring the traffic back.
You can exclude several values at once, including several values of the same kind: for example, hide two countries and one referral channel in one view.
Saved views
Saved views store the current dashboard state:
- Date range.
- Comparison settings.
- Filters and filter mode.
- Widget tabs and sorting.
- Selected metric where supported.
Use personal views for your own workflow. Use team views when the same view should be available to teammates.
Default views
If you frequently start from the same dashboard state, set it as your default view — the property dashboard will then open with that state applied. The default view is personal and stored in your browser; it does not change what teammates see.